
Frequently Asked Questions for the CAS Fatigue Risk Model
What is the CAS Fatigue Risk Model?
The Circadian Alertness Simulator (“CAS”) is a tool that assesses and predicts an individual’s (or group’s) fatigue level. You upload a work schedule, CAS runs the data through biomathematical models, and you get a fatigue risk score from 0-100. The higher the number, the higher the fatigue risk.
Is the CAS Fatigue Risk Model new?
No, in fact, CAS is the longest operationally used biomathematical fatigue risk model with a 25+ year validated record of reducing errors, incidents, and injuries in a wide variety of industry applications. Since its initial development, it has been protected by a portfolio of multiple patents since 1993. Over that period the CAS Fatigue Risk Model – and its fatigue score and risk curve - have been continually optimized against millions of real-world work hours and the interplay of fatigue and actual human errors, accidents, and injuries in diverse operational settings. The result: CAS has emerged as a critical tool to help extended-hours operations proactively assess, benchmark, and manage fatigue risk in real-world operations.
How does the CAS Fatigue Risk Model calculate a fatigue risk score?
You enter a work schedule containing a minimum of 7 days of work history and CAS uses the laws of circadian sleep physiology to estimate the duration, timing, and quality of sleep for each sleep opportunity before and after any given duty-rest schedule. It then uses a three-process model which combines homeostatic factors (build-up of sleepiness during wakefulness and dissipation during sleep), circadian factors (the phase of the human biological clock, time of day), and sleep inertia (the transitory impairment of alertness on arousal from sleep depending on the circadian phase, length of sleep and level of prior sleep deprivation) to calculate the output measurement of a fatigue risk score.[1]
What is the output measurement of CAS?
CAS converts on-duty and rest data from scheduled work patterns into a fatigue risk score between 0-100. The higher the number, the higher the fatigue risk. We classify the fatigue risk score number into 3 zones:
- Green Zone: Low Fatigue Risk0 - 30
- Yellow Zone: Average Fatigue Risk31 - 55
- Red Zone: High Fatigue Risk56 - 100
Will CAS provide a Fatigue Risk Score for each schedule entered into the tool?
As shown in Figure 1 below, the result report allows you to sort by employee ID, name, fatigue score, start date, and end date. It also allows you to search for a specific individual. The report automatically defaults to showing the highest fatigue risk scores first, so you can quickly identify your most at-risk schedule and/or employee.
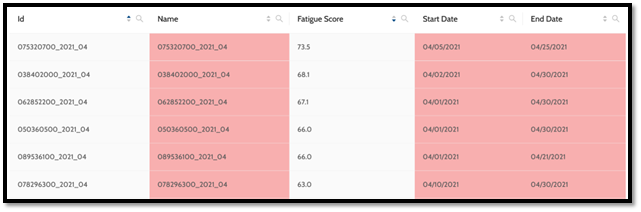
Figure 1: The Circadian Alertness Simulator (CAS) provides a “fatigue risk score” for each work schedule. You can analyze one schedule or multiple employee work schedules. You can sort the results based on several variables and can export the results to a CSV file or save the report in your account. ©2023 Circadian Technologies, Inc.
Does the Fatigue Risk Score Report include a visual summary of the data?
Does CAS provide a fatigue risk probability curve?
Overlaid on the fatigue risk score distribution chart is a risk probability curve. The risk curve was developed and optimized using thousands of real-world workdays in diverse 24/7 environments. As the fatigue risk score increases for each work pattern, so does the relative probability of having an incident, error, or accident - see Figure 2 below.
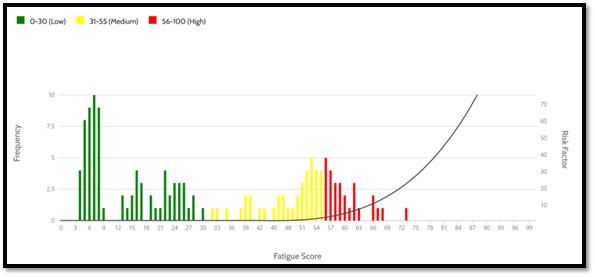
Figure 2: The Circadian Alertness Simulator (CAS) provides a “fatigue risk score” for each work schedule. The chart above shows the distribution of different work schedules’ fatigue risk scores. As the fatigue risk score increases, so does the relative probability of having an incident, error, or accident – as indicated by the black curve that rises as scores increase. ©2023 Circadian Technologies, Inc.
Is the CAS fatigue risk curve based on lab data or real-world data?
CIRCADIAN has been able to optimize our risk curve against real-world incidents/accidents over the past 25+ years from a wide variety of extended-hours operations (e.g., transportation, manufacturing, energy, etc.). Since human performance is complex, especially in real-world operational environments, optimizing the risk curve against the interplay of fatigue and actual human errors, accidents, and injuries provides a more meaningful metric than something derived from laboratory conditions.
Can the Fatigue Risk Score report be saved and/or exported for record keeping and benchmarking?
Yes, the fatigue risk score report can be exported to a CSV file or saved in your online account.
How are schedules entered into CAS?
Schedules can be uploaded into CAS as either a .CSV or .XML file. For flight operations with schedules that included airport codes, only XML files are accepted at this time.
How do operations utilize CAS?
With CAS, operations now have an easy way to objectively measure and track employee fatigue levels. This tool can be used for:
- Risk-Informed Scheduling & Planning: With CAS, you can answer the following questions to make risk-informed decisions:
- What are the fatigue risk scores of our core work schedule?
- Who are my most fatigued employees?
- Can I lower a bid schedule risk by adjusting assignments?
- How does this overtime assignment influence an employee’s fatigue score? Is there someone else that would be better suited to work the shift?
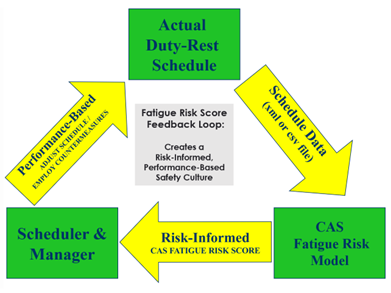
Figure 3: The Circadian Alertness Simulator (CAS) supports a risk-informed, performance-based safety culture. By providing a “fatigue risk score” for each work schedule it enables schedules/managers to assess the risk and take actions to reduce the risk if needed. ©2023 Circadian Technologies, Inc.
- Real-Time Assessments: CAS can be utilized when operational changes occur:
- I need to cover an unscheduled absence:
- Who are my least fatigued employees?
- What would their fatigue levels be if I assigned them to this shift?
- Deviations (e.g., flight delays, extended shift due to emergency, etc.):
- How does this delay impact the fatigue scores of the pilots?
- Is there another available pilot whose fatigue risk is lower?
- How does this extended shift impact my employees?
- Benchmarking Fatigue:
- What was the fatigue risk of my employees over the past 30-day period?
- Did fatigue risk scores from the planned bid schedules match what actually happened?
- What were the fatigue risk trends over the past 6-month period?
- Safety:
- What was the fatigue score of the individual at the time of the incident?
- Is there a trend between safety events and fatigue scores?
Does the fatigue risk score account for flight & cabin crew travel?
Yes, by inputting airport codes (e.g., BOS, DFW, ATL, etc.) into the work schedules of flight and cabin crew employees, CAS will automatically account for the impact of time zone shifts when calculating the fatigue risk score. Additionally, CAS will apply workload stress for pilot duty periods (e.g., take-off-landing, cruising flight, non-flight duty) to the fatigue algorithm.
When was the CAS fatigue risk model developed?
The initial development began in 1987 as a tool for evaluating and designing bid-packs, shift schedules and other duty-rest schedules. It was initially optimized and validated with over 10,000 days and nights of sleep and alertness measurements in transportation employees working in 24/7 operations. Since 1993 the intellectual property underlying the CAS algorithms has been protected by a series of multiple patents, CAS has been utilized in dozens of research and consulting projects for a wide variety of operations, which led to the continuous optimization of CAS using objective fatigue-related error, accident, and injury data. Over the past decade, CAS has been widely used for research, and consulting projects, including with government agencies, as well as by telematics and time & attendance companies.
[1] Moore-Ede M et al. “Circadian Alertness Simulator for Fatigue Risk Assessment in Transportation” Aviation, Space, and Environmental Medicine, Volume 75, Supplement 1, March 2004, pp. A107-A118(12).